


EUCF Final - CUSB Break Efficiency
How well did CUSB Shout play offence after a turn?

This type of chart is something I have created for my own teams in the past. I think this type of visual can be a really effective way to see trends that don’t show up from looking at stats or reviewing individual turnovers one at a time.
Key:
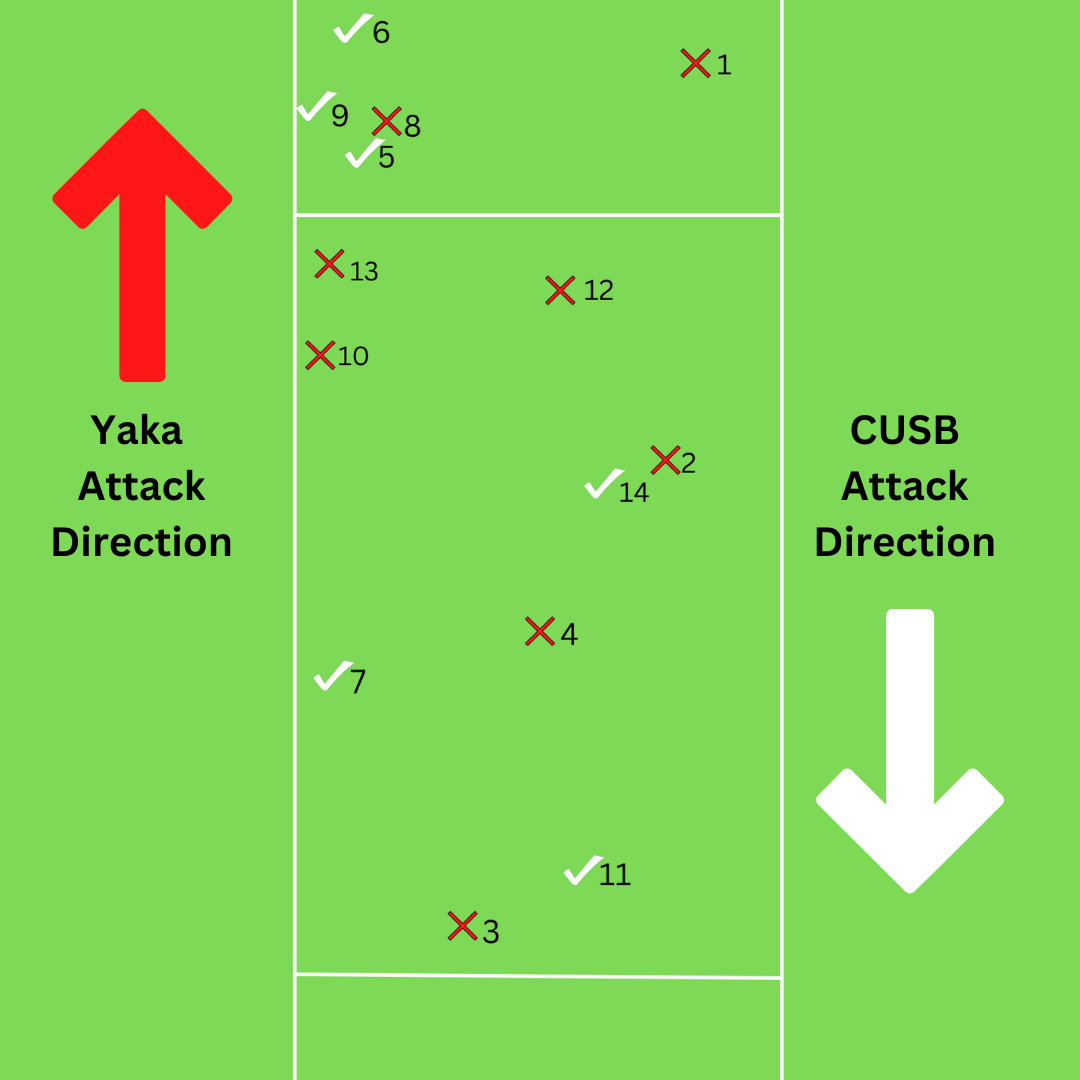
X - Yaka turnover location that did NOT result in a CUSB score on the subsequent possession
✓ - Yaka turnover that resulted in a CUSB score
1-14 - represents the order of the turnovers with 1 being Yaka’s first turn of the game and 14 their last
A few observations:
CUSB were remarkably efficient from turnovers that they generated in their defending endzone - to go full field 4/6 times is so good compared to their overall rate. They also did it back to back on turns #5 and #6 on consecutive D points when the game was still even. Two turns for Yaka on scoring opportunities turn into a big deficit. EUCF finals are ruthless.
CUSB got the disc back into play as quickly as possible after all their blocks. Looking at this sample only I would say that didn’t really work for them when they earned the block on the playing field and were able to immediately start playing*. Perhaps they were more efficient on the endzone turnovers because the small delay in bringing the disc forward gave them a better tempo. I could be biased here because that’s the sort of rhythm I really like - picking the disc up quickly to keep the situation fluid but not rushing. It’s a fine balance and it’s different for different teams.
CUSB were mostly playing a forehand force in their defending half of the pitch, so all the turnovers on the top left came from trying to move the disc to the breakside of the pitch.
Yaka did score 6 of their 9 goals in that left third of the pitch. It would be interesting to know if this was an intentional plan to attack the breakside, or if this is a result of most of Yaka’s stronger throwers preferring their backhands.
It’s also worth noting that the other 3 Yaka scores came on the right third of the pitch. The had no goals and no turnovers in the middle third of the endzone. I have no dataset for this but it seems unusual for that to happen. I’d give credit here to CUSB’s defence for not giving up that space.
Overall watching the game through this lens made me appreciate better the way CUSB’s defenders did an intense and disciplined job on the mark and downfield on the open side. Since they weren’t racking up a lot of spectacular blocks - though they did get some - it may not have stood out as a great defensive performance at first. However, they really made everything difficult for Yaka’s offence. I love this type of defence and they did pretty much everything that I wrote about in my first ever blog.
*to add to this theory, on turn #11 there was a long discussion about the turnover, which again may have worked to slow down CUSB’s breakneck tempo a touch
"The had no goals and no turnovers in the middle third of the endzone." = where the stack is maybe?